NDVI, Copernicus & Satellite Verification
NDVI (Normalized Difference Vegetation Index) is a numerical indicator derived from satellite imagery that estimates vegetation “greenness” and vigor.
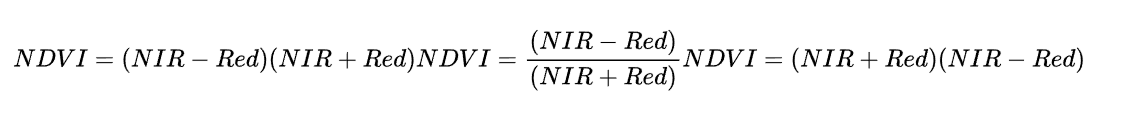
Formula
-
Red band: vegetation absorbs this for photosynthesis
-
Near-Infrared (NIR): vegetation reflects this strongly if healthy
Value range
| NDVI value | Interpretation |
|---|---|
| -1 to 0 | Water, snow, clouds |
| 0–0.2 | Bare soil, rocks |
| 0.2–0.4 | Sparse vegetation, grass |
| 0.4–0.6 | Healthy vegetation |
| 0.6–0.9 | Dense forest canopy |
Key point: NDVI does not detect “trees” directly — it detects photosynthetically active biomass.
Copernicus & Sentinel-2: what data you actually get
Sentinel-2 key specs
-
Spatial resolution:
-
10 m (Red, NIR) → NDVI is 10×10 m per pixel
-
-
Temporal resolution:
-
Every 5 days globally
-
-
Cost: Free, open data (huge win for DAOs)
-
Bands: 13 spectral bands (visible + infrared)
This means:
-
One pixel ≈ 100 m²
-
You cannot see individual saplings
-
You can see land cover trends over time
What NDVI can verify
Strong, defensible claims
These are blockchain-safe claims you can attach to smart contracts:
1. Vegetation increase over time
“NDVI increased from 0.21 → 0.47 over 18 months in polygon X”
This is robust, auditable, and repeatable.
2. No-regression guarantees
“NDVI did not fall below baseline for 12 months”
Useful for:
-
Anti-deforestation clauses
-
Delayed DAO payouts
3. Seasonal survival trends
By comparing same season year-over-year, you can show:
-
Whether vegetation persists
-
Whether the area is stable or degrading
4. Area-based verification
You can verify:
-
Hectares showing sustained vegetation
-
Continuity of canopy cover, not just spot planting
Canopy cover analysis (beyond basic NDVI)
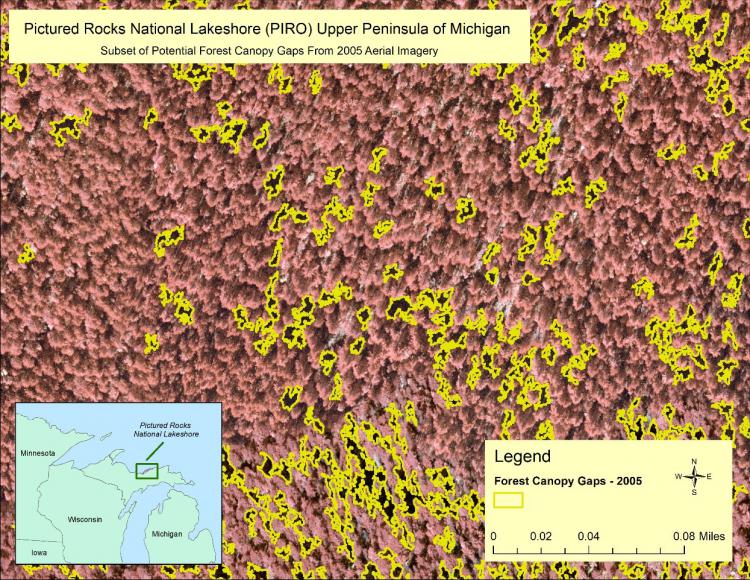

NDVI alone is not enough for forest-quality claims. Typically you combine:
Techniques used in practice
-
NDVI thresholding
-
e.g. NDVI > 0.5 = likely canopy
-
-
Time-series smoothing
-
filters out noise & weather artifacts
-
-
Change detection
-
ΔNDVI between years
-
-
Masking
-
exclude water, agriculture, urban areas
-
What canopy analysis can say
-
“This area transitioned from low biomass to sustained canopy”
-
“Vegetation density increased and stabilized”
What it cannot say
-
Tree species
-
Forest age
-
Biodiversity quality
-
Native vs invasive plants
Limitations you MUST be explicit about (to avoid greenwashing)
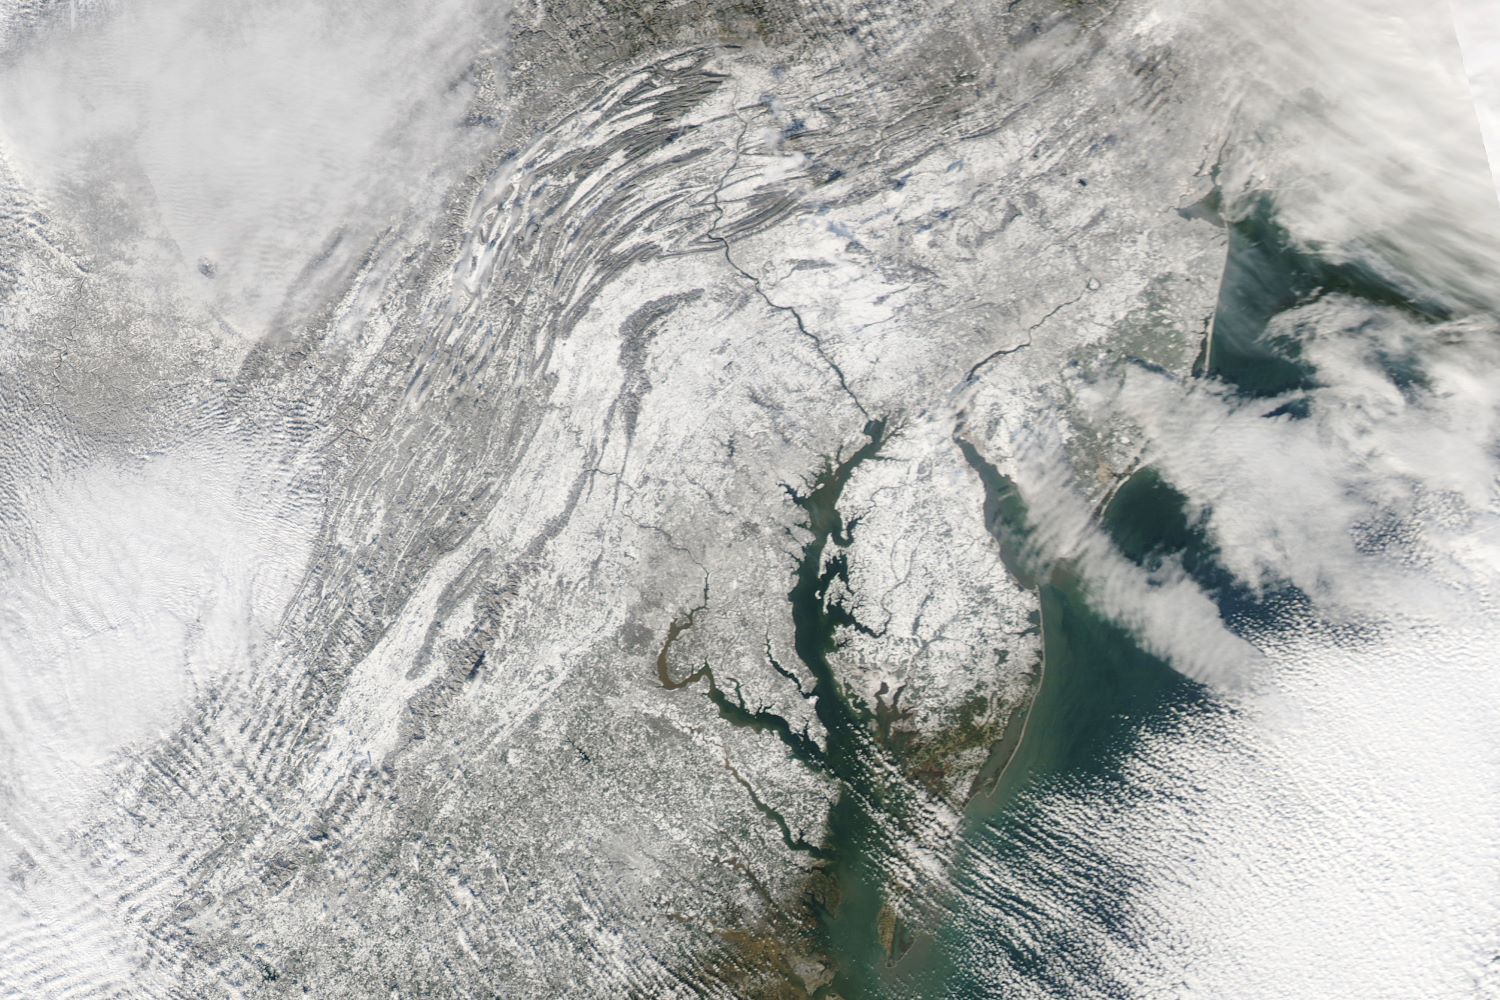
1. Cloud cover
-
Optical satellites cannot see through clouds
-
Tropical regions can lose 30–60% of observations
-
Mitigation:
-
Cloud masking
-
Multi-month aggregation
-
DAO rules that accept “data gaps”
-
On-chain implication:
Smart contracts must tolerate missing data windows.
2. Resolution constraints (10 m)
-
Young trees <2–3 years may be invisible
-
Agroforestry can look like forest
-
Shrubs can inflate NDVI
You cannot claim:
“10,000 trees planted”
3. Species identification is impossible
NDVI:
-
Does not know what is growing
-
Does not know why it’s growing
A monoculture plantation can score higher NDVI than a biodiverse forest.
Mitigation strategies
-
Combine with:
-
Field audits
-
Community attestations
-
NGO validation NFTs
-
-
Use NDVI as one oracle, not the only one
4. Cause vs correlation
NDVI increase ≠ successful reforestation
It could be:
-
Natural regrowth
-
Agricultural cycles
-
Irrigation changes
Honest framing:
“This project contributed to vegetation recovery as verified by satellite indices”
Not:
“This project restored a forest ecosystem”
6. What claims are DAO-safe vs DAO-dangerous
Safe, verifiable, professional claims
-
“Vegetation cover increased”
-
“NDVI stabilized above baseline”
-
“No major deforestation detected”
-
“Land cover change confirmed by Copernicus”
Dangerous claims (avoid on-chain)
-
Exact tree counts
-
Species restoration
-
Biodiversity recovery
-
Carbon sequestration without models + field data
No comments to display
No comments to display